

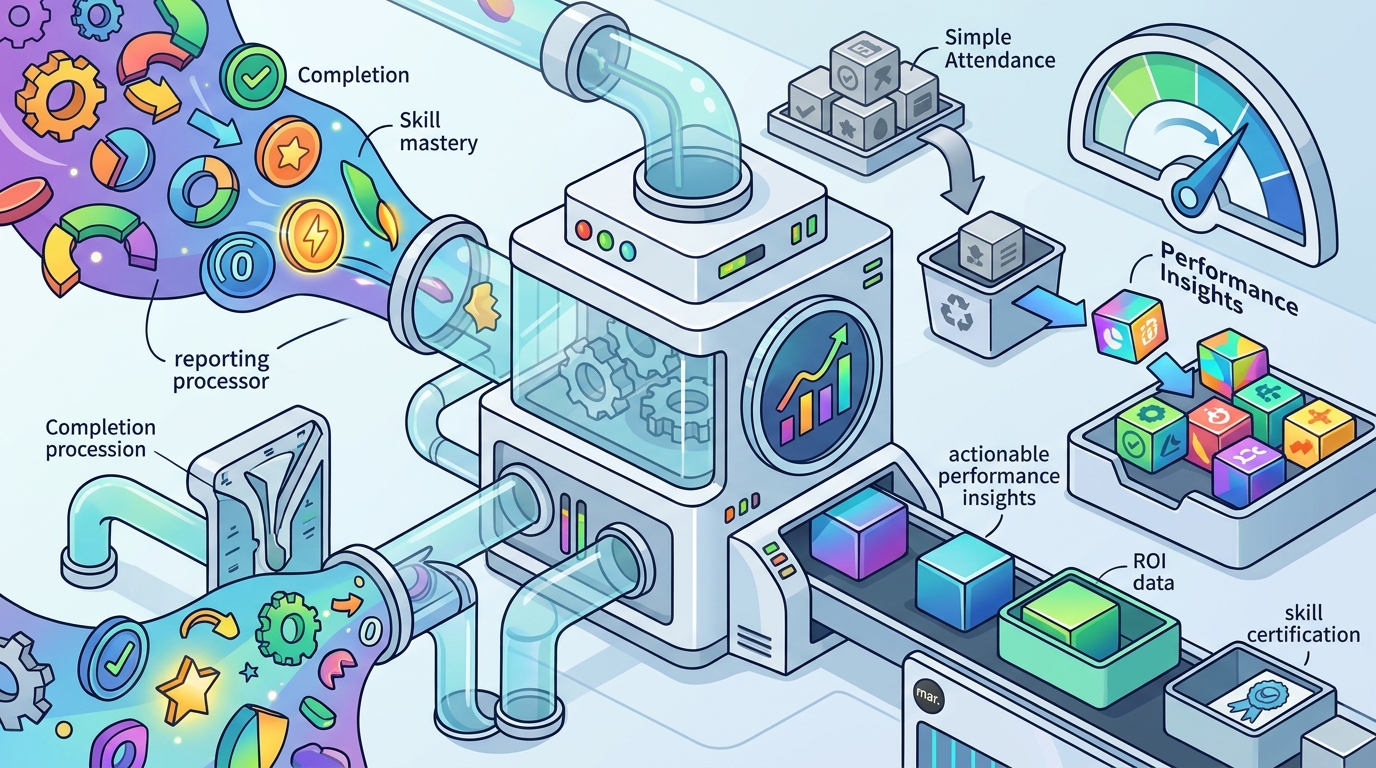
Tracking learner completion and performance is the process of monitoring how employees interact with training content and measuring their mastery of specific skills. For organizations using custom content, this data is critical for proving the return on investment of your training programs. GoSkills provides a robust reporting framework that helps administrators move beyond simple attendance logs to actionable performance insights.
1. Real-Time Completion Dashboards
Instant visibility into who has finished their assigned training. A completion dashboard provides a high-level view of your training landscape at a glance. It displays the percentage of learners who have successfully finished a course or module. This metric is the first line of defense against compliance gaps and ensures that critical onboarding or safety training is not being ignored.
2. Granular Lesson-Level Progress Reports
Identify exactly where learners are getting stuck. Course-level completion rates can hide specific pain points. Lesson-level reports allow you to drill down into individual modules to see where users drop off or spend excessive time. This granularity helps instructional designers refine content that is confusing or too difficult, ensuring a smoother learning experience for future cohorts.
3. Assessment and Quiz Score Analysis
Measure actual knowledge retention, not just time spent. Completion does not equal comprehension. By analyzing quiz and test scores, you can verify that learners have truly absorbed the material. GoSkills allows you to track average scores per lesson and identify specific questions where the majority of the team is failing. This data is essential for validating the effectiveness of your custom content. according to How Teachers Can
4. Time Spent Learning Metrics
Correlate engagement depth with learning outcomes. Tracking the total time spent on a course helps distinguish between active learning and passive scrolling. If a learner completes a 30-minute course in 5 minutes, the data flags a potential issue with engagement or content quality. Conversely, high time spent with low scores may indicate that the material is too complex or poorly structured.
5. Team-Based Performance Aggregation
Compare skill acquisition across different departments or roles. Aggregating data by team allows you to see how different groups perform on the same training. This is particularly useful for identifying if a specific department requires additional support or if a role-specific training path is more effective than a general one. It helps in tailoring future training strategies to specific workforce segments.
6. Certificate and Credential Tracking
Automate the verification of skill acquisition. Tracking the issuance of certificates provides a clear record of who has achieved a specific competency. This is vital for compliance-heavy industries where proof of training is required for audits. GoSkills automates this process, ensuring that certificates are only awarded upon successful completion of all required assessments and modules.
7. Learner Feedback and Satisfaction Surveys
Capture the subjective experience of the training. Quantitative data tells you what happened, but feedback tells you why. Post-course surveys help you understand if learners found the content relevant, engaging, and applicable to their daily work. This qualitative data is crucial for improving the learner experience and ensuring that your custom content resonates with your audience.
Choosing the Right Tracking Method
Select your tracking focus based on your primary business goal. If your priority is compliance, prioritize completion and certificate tracking. If your goal is skill improvement, focus on assessment scores and lesson-level progress. A balanced approach using a platform like GoSkills allows you to monitor all these dimensions simultaneously, providing a holistic view of your training program's impact.
Frequently Asked Questions
What is the difference between completion rate and performance?
Completion rate measures whether a learner finished the course, while performance measures how well they understood the material, typically through assessments. A high completion rate with low performance scores indicates that learners are finishing the course but not retaining the information.
How often should I review training progress reports?
It is best to review high-level dashboards weekly to catch immediate issues. Detailed performance and assessment reports should be reviewed monthly or quarterly to identify trends and inform long-term content improvements.
Can I track progress for custom content created in GoSkills?
Yes, GoSkills provides the same robust reporting capabilities for custom content as it does for its built-in library. You can track completion, time spent, and assessment scores for any course you create using the GoSkills course builder.
What is the best way to handle learners who are not completing training?
Use automated reminders to nudge learners who are behind schedule. If completion rates remain low, review the lesson-level data to identify if the content is too difficult or if the learners are facing technical barriers.
Does GoSkills support exporting training data?
Yes, GoSkills allows you to export reports to Excel or CSV formats. This enables you to integrate training data with other HR systems or perform custom analysis outside the platform.
Start Tracking Your Team's Progress
Effective training requires more than just delivering content; it requires measuring impact. By leveraging the reporting tools in the GoSkills LMS, you can gain full visibility into your team's learning journey. Create your free GoSkills account today to start building custom courses and tracking performance with confidence.